WebLOAD’s integration with Dynatrace, a leading application performance management tool, helps you trace the root cause of performance issues, which you detect during your load testing.
Using a single click you can switch from WebLOAD’s test results to Dynatrace and zoom in on the related server-side events. You can drill down from a specific time frame in your load test or from a server error message displayed in your load test results.
Trace events during a specific time frame
In WebLOAD’s graphs, you can view any abnormal behavior, such as a spike in response time, then right-click the desired graph area and directly switch to Dynatrace.
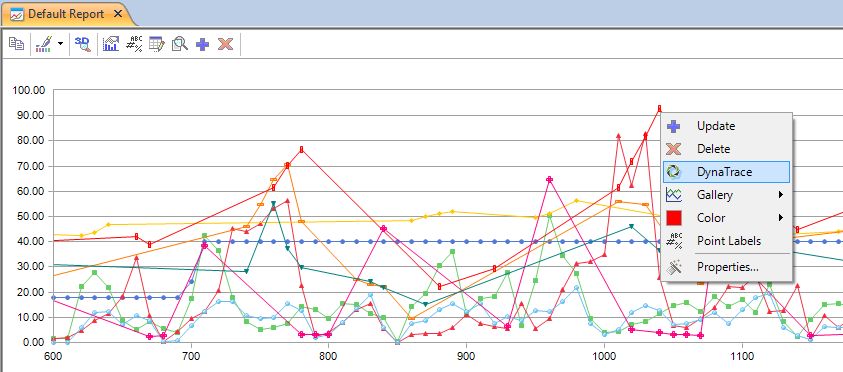
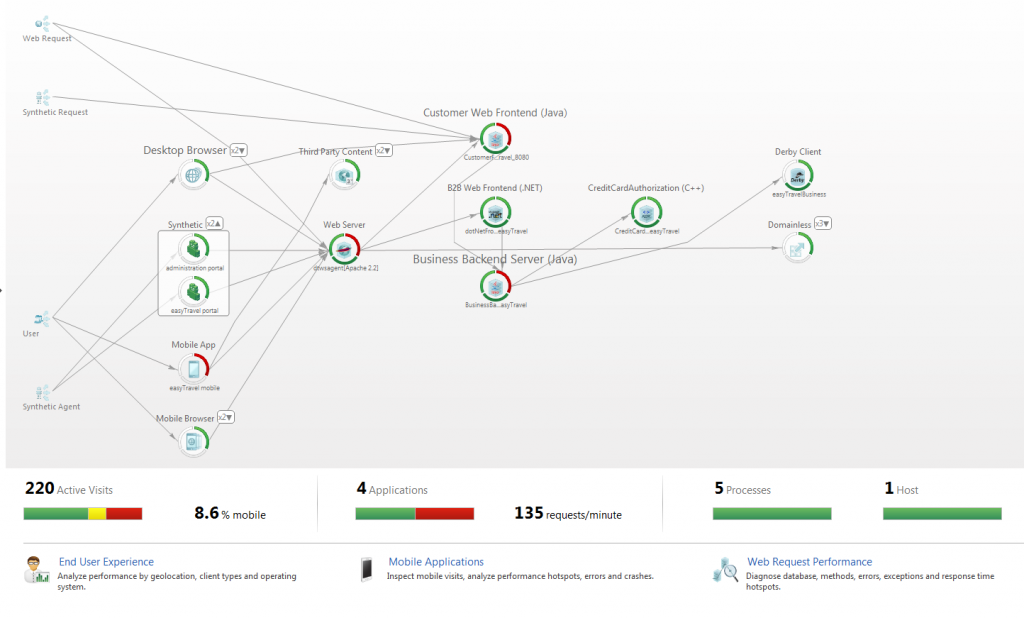
Dynatrace automatically opens up a topology outlining server-side events during the specific time frame in your load test, letting you drill further down as much as needed.
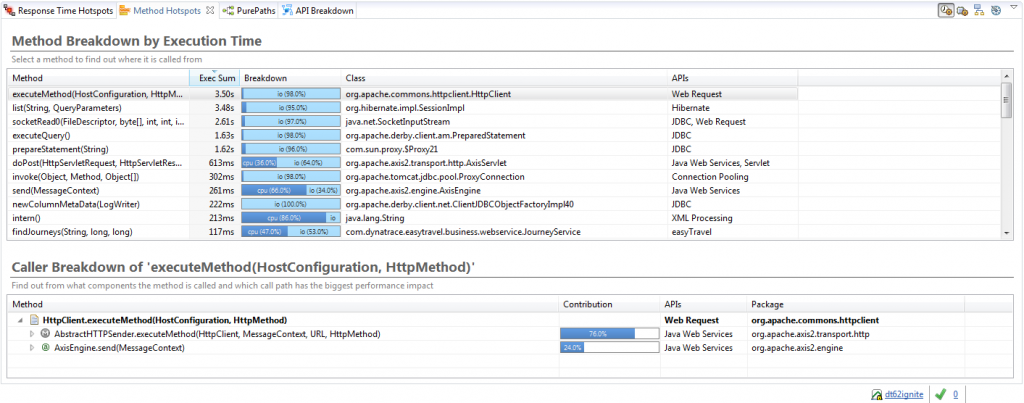
Trace events related to an error
During load testing, WebLOAD lets you view specific server errors, such as HTTP error 500 received for a specific request. By clicking the error you can move to Dynatrace, view the topology of the specific instance and gain visibility into the call stack, methods and API calls related to the error received.