Actionable Intelligence
WebLOAD provides you with actionable intelligence to help you identify performance bottlenecks in your system. Combining performance metrics with data collected by server monitors, it provides you with over 80 out-of-the-box reports and graphs that let you drill down at any angle and granular level to pinpoint problems.
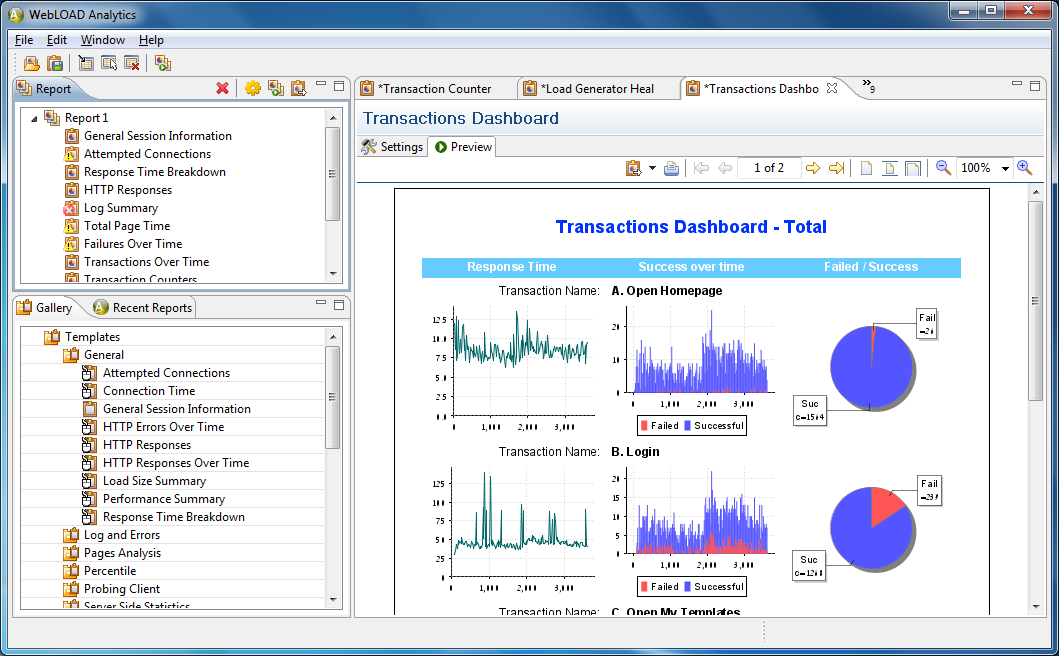
Customizable Reports
Customizable reports enable you to zoom down on specific areas and to compare metrics across load sessions. You can choose from a variety of templates and apply filters, change the design, and save your choices.
After a test run, WebLOAD Analytics automatically generates a set of reports and indicates places where threshold violations occurred so you can drill down on problem areas immediately. When you launch WebLOAD Analytics after a test run, your default charts are automatically opened, and threshold rules are applied. Charts with threshold violation are marked in the report view. At a glance, you can see flags such as connection issues and slow page times. Clicking on a chart shows the details.
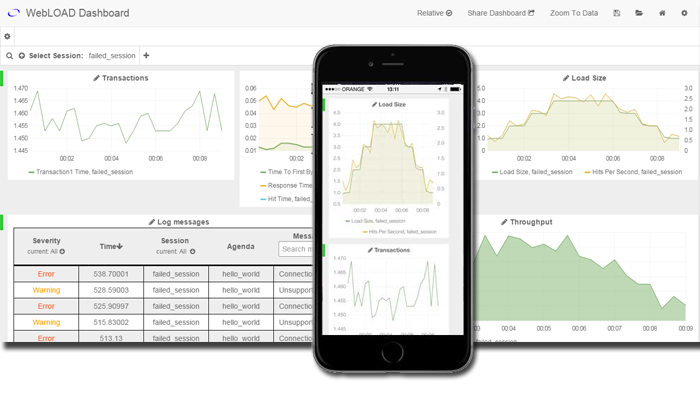
Web Analysis Dashboard
The Web Dashboard improves the efficiency of your test analysis and resolution process with access to performance test results from any web browser or mobile device. Share and communicate results such as response/transaction time, throughput and errors between multiple team members and report performance issues to management. You can:
- Customize your own views of results and graphs
- View real-time result of tests as they are running
- Share a customized report view with colleagues
- View results from tablets and smartphones