Monitoring server performance under load
WebLOAD collects server-side performance data from operating systems, web servers, application servers, and database servers to help you identify the root-cause of problems. By correlating your load scenario with data such as CPU, memory, capacity, processes, disk I/O, queue data, etc, you can quickly track down bottlenecks and pinpoint the weak links in your system.
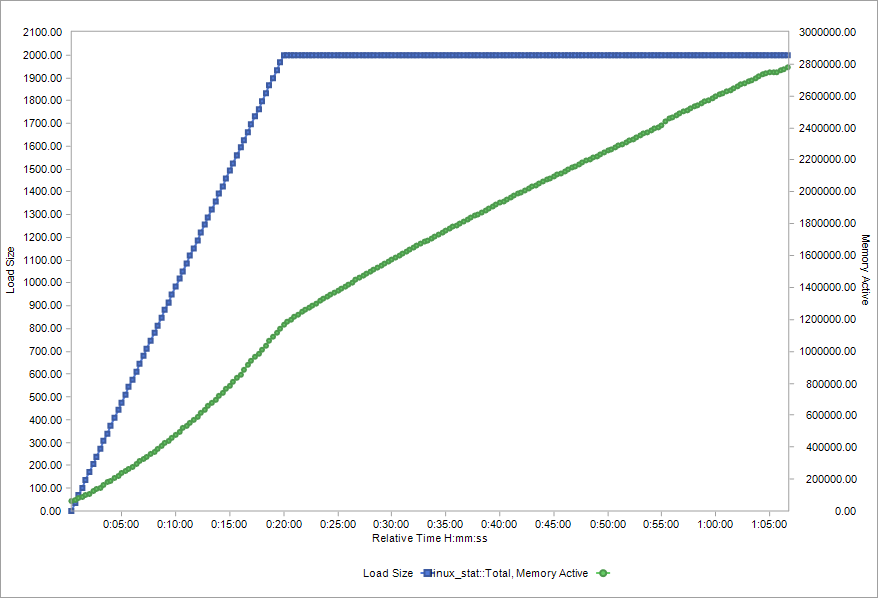
Server side data is displayed in real time as part of WebLOAD’s results analytics reports. This simple example presents memory degradation as the load size is increased.
WebLOAD’s monitoring is agentless, requiring no server-side installation. It can be configured to handle secure servers located behind a firewall, supports the import of server-side statistics from 3rd party monitoring tools, as well as the export of monitoring data to external systems.
Built-in server monitoring
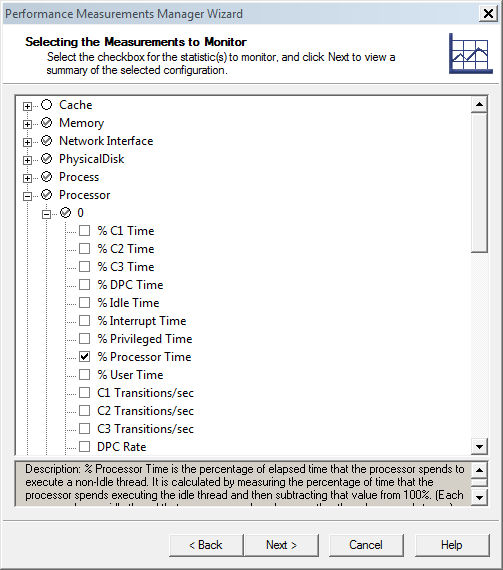
WebLOAD provides out-of-the-box monitoring for a range of operating systems, web servers, application servers databases. For the full list, see the Supported Technologies page.
In addition, WebLOAD supports standard APIs through which servers expose performance data – such as JMX, SNMP, RSTATD, Windows Performance Monitor, SSH, and JDBC.
Root-cause Analysis using APM tools
WebLOAD’s built-in integration with application performance management (APM) tools helps you take root cause analysis one step further. Once you identify a performance issue using WebLOAD you can switch to your APM tool and correlate the WebLOAD transaction to the server-side event. You can accurately identify events behind bottlenecks and quickly resolve issues.
WebLOAD currently provides built-in integration with Dynatrace and AppDynamics.