Load test analysis offers many opportunities for reach wrong conclusions. One of the most common ones results from overloading the load generator machines – the machines used to run virtual users and simulate load. You run your tests with your target load, then view poor measurements that seem to indicate your system is having serious performance problems. Yet the real issue is simply the overloaded load generators.
Can this be avoided? Definitely. Here are two main paths you can take to detect issues related to overloaded load generator.
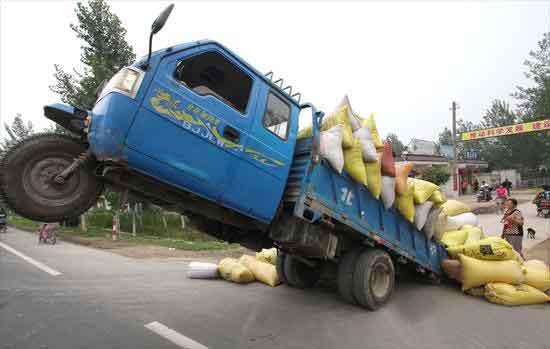
Can a truck manage with two wheels? Ignoring overloaded load generators may lead you to wrong conclusions about your system under test.
Checking Load Generator Resources
Just like you collect performance measurement from the system under test (SUT), you should collect performance measurements from the load generator machines to detect their status. The obvious ones are CPU utilization and memory usage. But typically these are not enough and you should examine additional measurements.
- Context switches per second. This measurement lets you understand in greater depth the CPU activity. A high context switching number indicates that the CPU is less efficient, spending more time on itself than performing its task.
- Page faults. Page faults lets you drill deeper into the memory status. When this number is high it indicates the system is spending resources on writing data to disk, pointing to inefficiencies and potentially harming performance.
- Disk queue length. Although there are several disk counters, I like this one the most, and from my experience it provides good indications. While a queue for writing to the disk will always exists, if this number constantly increases, it might indicate that the load generator is overloaded. Of course if the queue length increases while the load size is constant, the indication is even stronger. To learn more about this behavior and threshold numbers, look here. Also, this link provides tips on how to define the threshold for io counters.
The key challenge of these indicators is how to find their threshold. Ideally, you’d want to generate load that will let you reach the limits of the load generator machine – before even testing your SUT. How will you know you reached the load generator limit? One way is reaching a point where the Transaction per Second figure stops increasing while the load size is increased.
Comparing the Probing Client to the Load Generator
The idea here is to compare the load generator, which create thousands of virtual users with a ‘probing client’ machine – a separate machine that executes a single virtual user.
Let’s assume we increase the load size and see that TX/sec value is not growing linearly. How do we know which entity to blame – the application or the load generator? We can examine the TX/sec created by the Probing client. If it remains constant even when the load increases, this means that our load generator is having trouble – not our SUT. And vice versa.
How WebLOAD can help
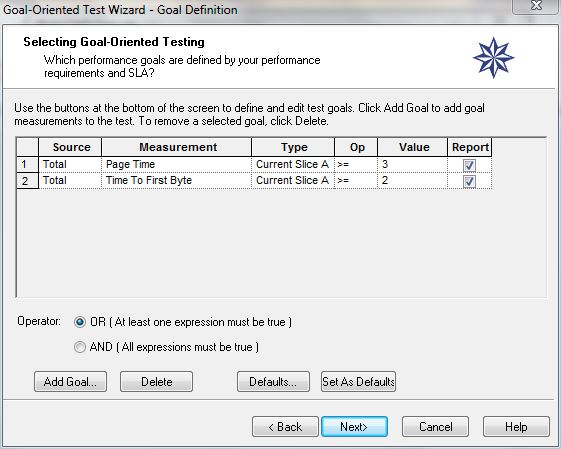
WebLOAD’s Goal Oriented Testing feature constantly monitors load generator machines. It helps you:
- Reach the target load you want by gradually increasing the number of virtual user till your goal (say a 3 second response time) is met.
- Prevent an overload of load generation machines skewing your SUT results.
This is done by automatically distributing the load between load generation machines.
To learn more, read about WebLOAD’s Test Execution.
-
James Pulley